Project
Within the project environment, you can navigate through different levels to view or edit information. Here's how it works:
Navigating through Datastorms
The Datastorms interface contains three main areas:
1. Menu
On the left the menu is shown. By clicking a menu item, you open the corresponding page. The generic search option is visible above the menu.
2. Page
After clicking on a menu-item, a page is opened on the right. On this page data is visualized based on the purpose of the page.
3. Object Detail screen
Clicking once on a data item opens its Object Detail screen. This represents the lowest level in the project navigation, while multiple pages can be accessed from here, this is where your navigation begins.
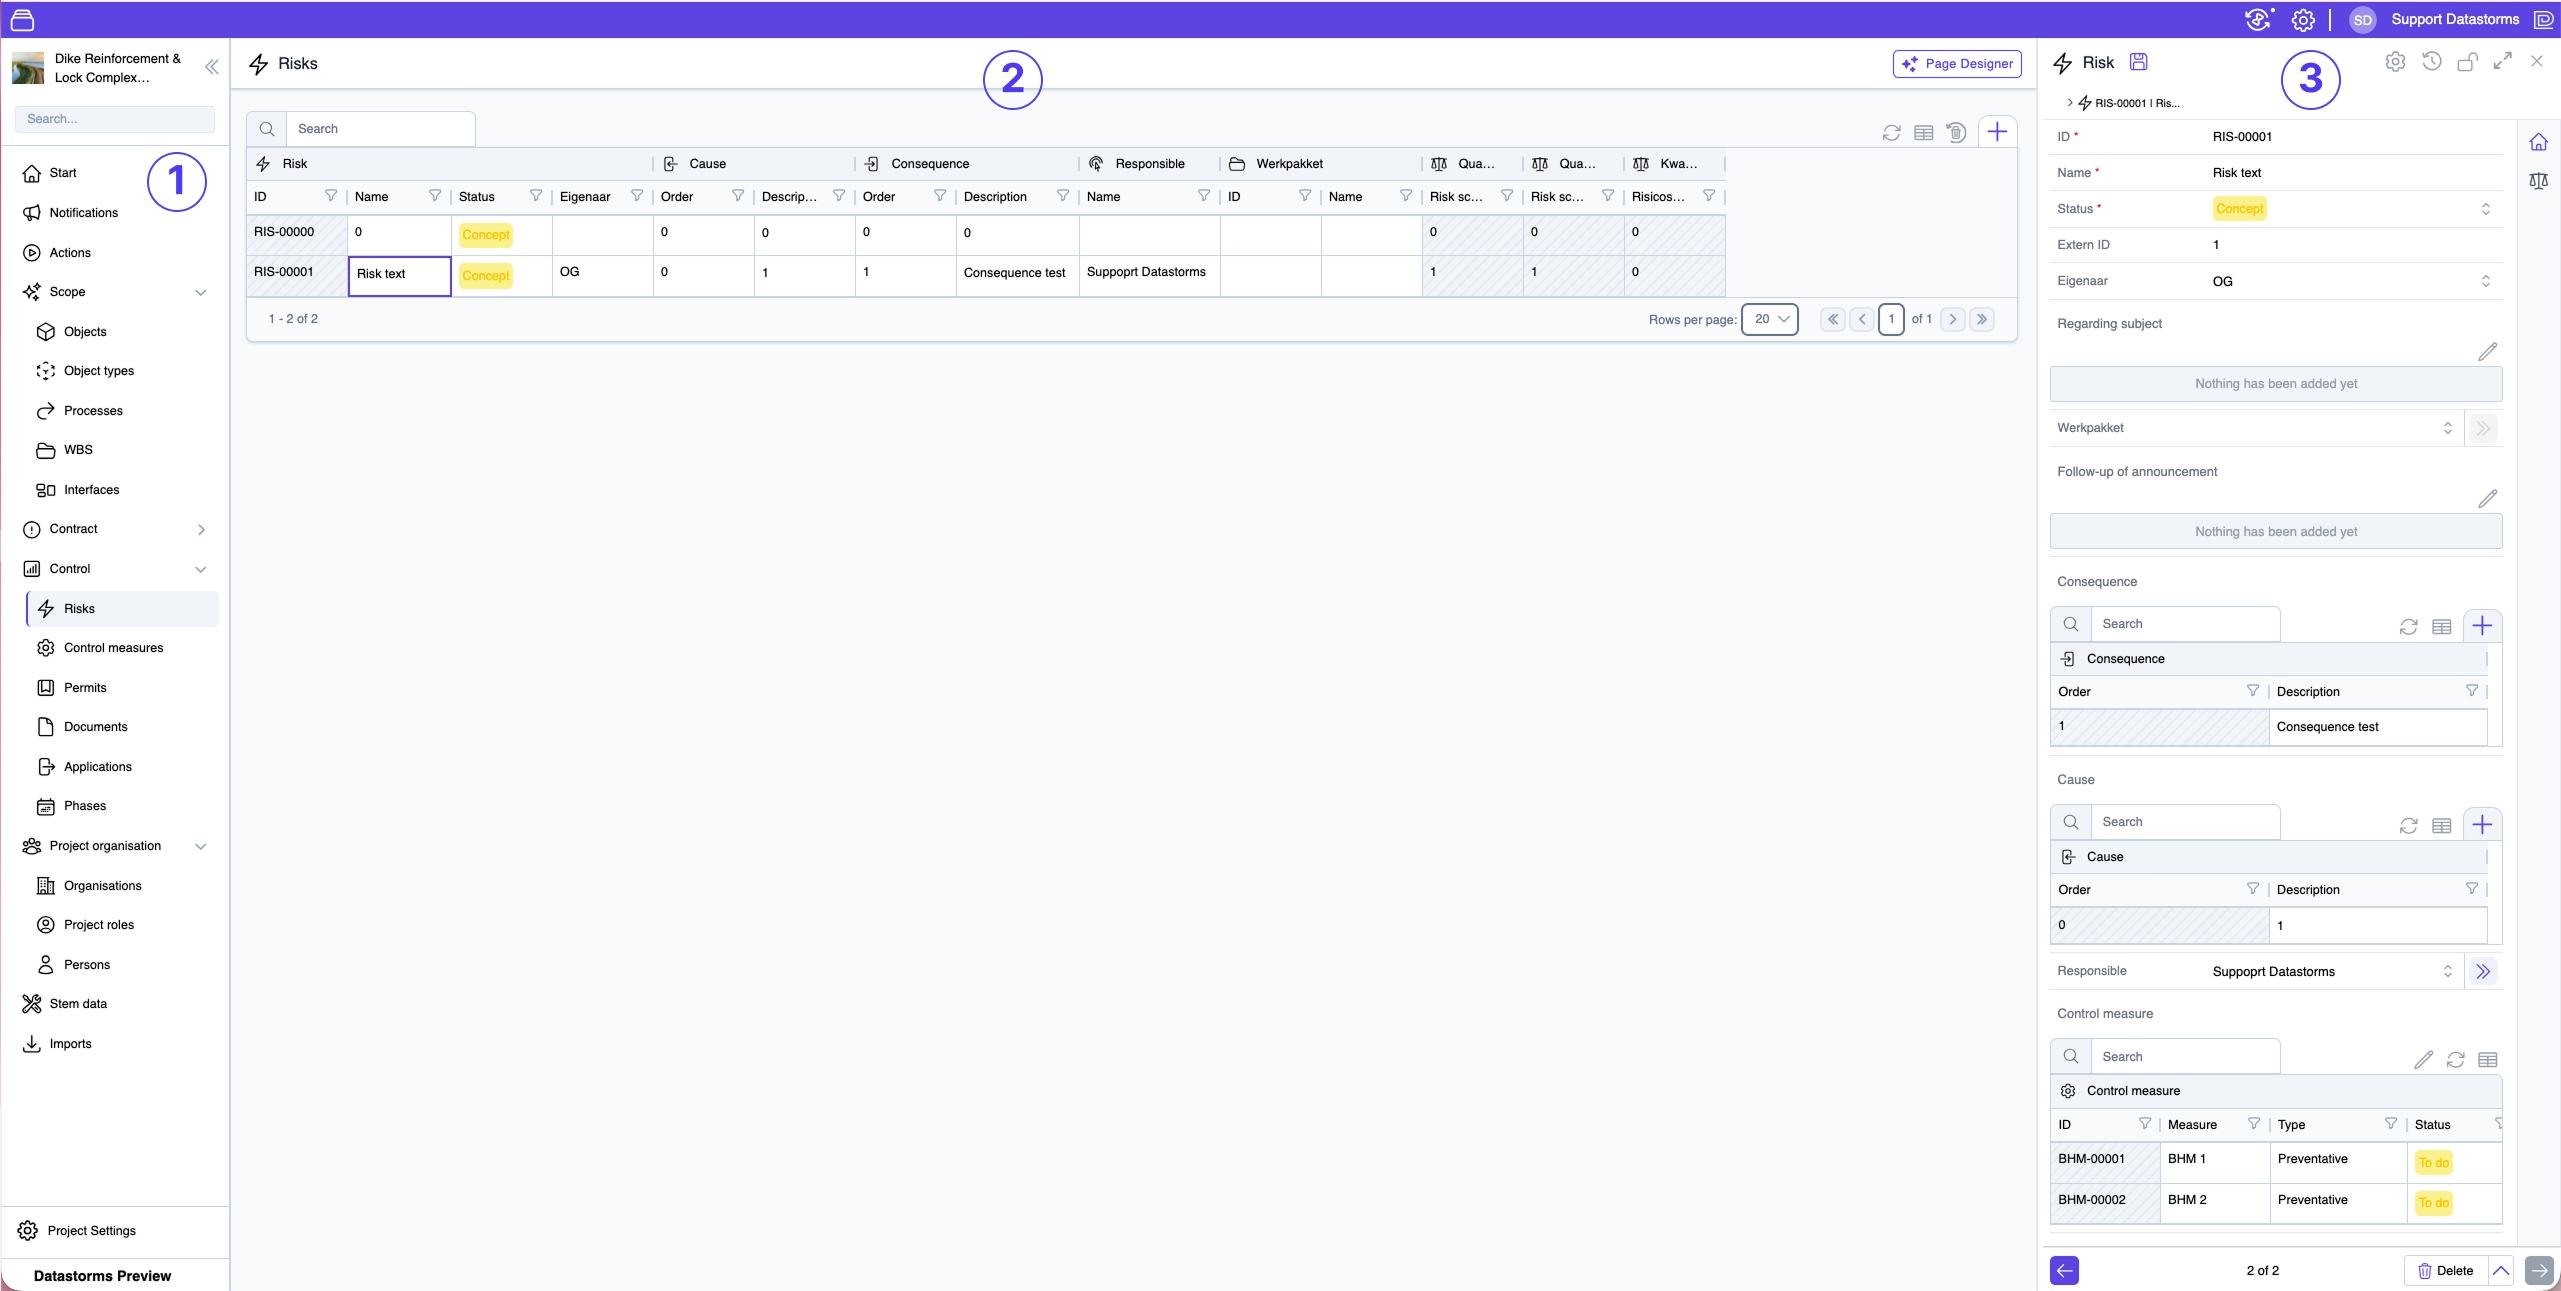
At the top of the Object Detail screen, a breadcrumb trail shows your current position within the project structure (check out number 3 in the picture). This allows you to easily see the navigation path you've taken and quickly return to previous levels by clicking on any of the breadcrumb links.
Pages
On a page, several types of components can be displayed. The most common are:
- Map – Visual representation of geographical data.
- Actions – A component that start a programmed action or workflow.
- Table – The most frequently used component for displaying data.
- Tree (not shown on the screenshot below) - Showing the structure of the data.
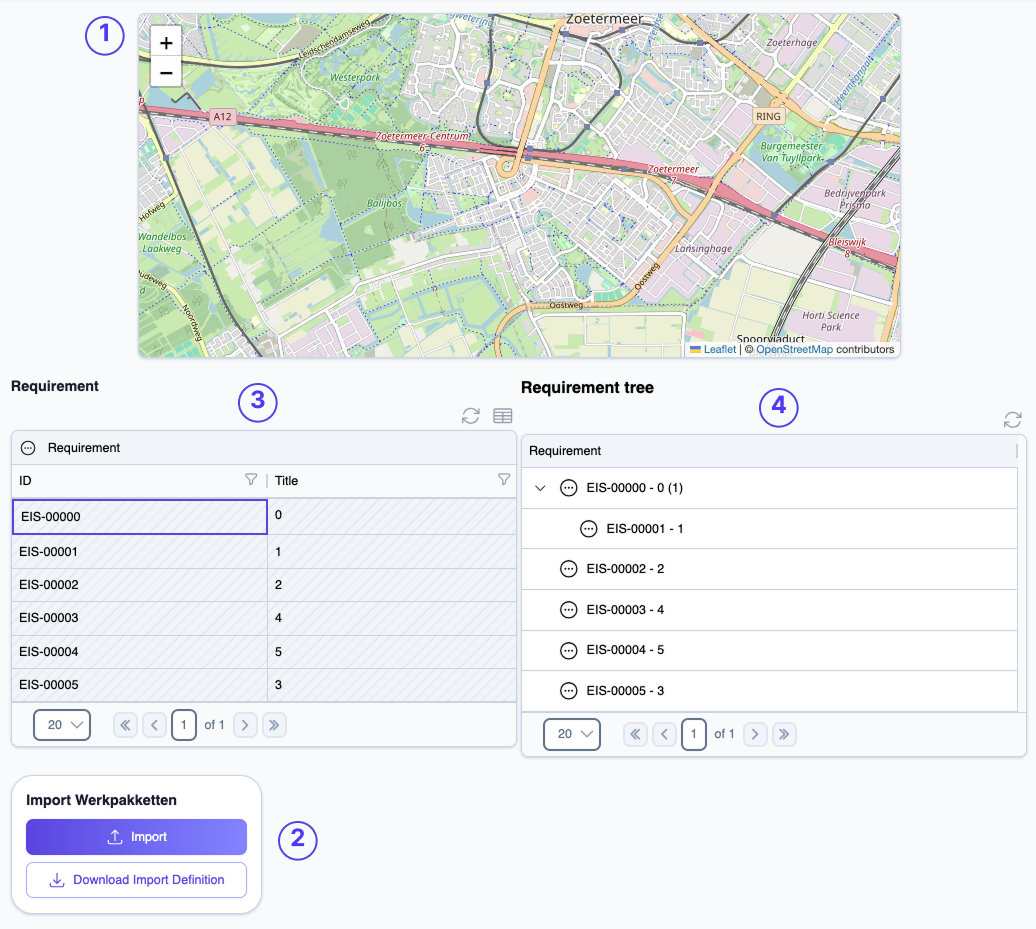
All components and how you can use them are discussed in the Component section.