Dashboard
You can use a Dashboard to show summaries or counts of certain data inside a project. Examples of these kind of queries are:
- Open activities
- Announcements this month
- Vacant actions: nobody assigned
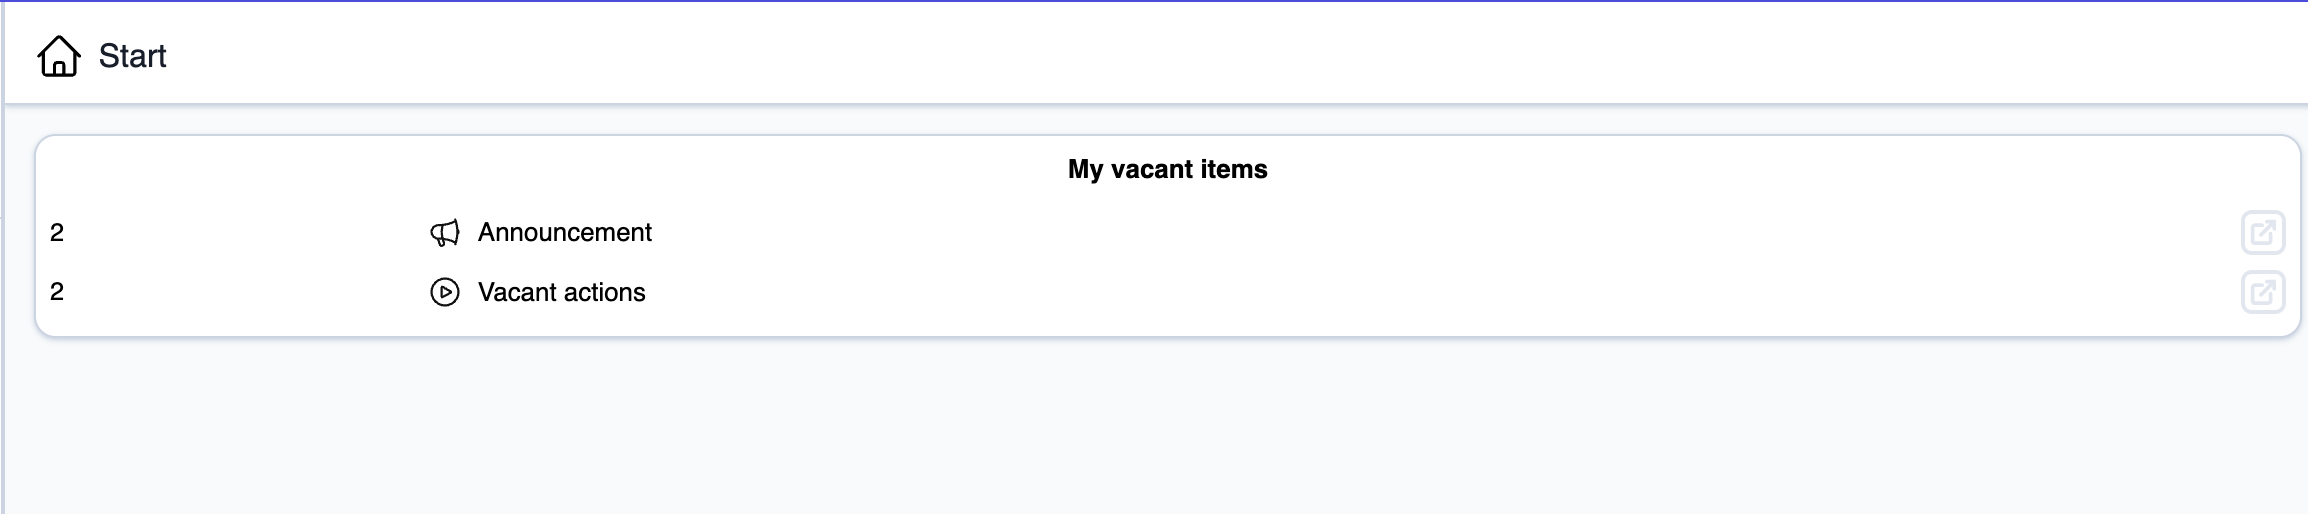
A pop-up window appears when you click on a specific Dashboard-line. In this popup window a table is shown that contains more information of the instances of the selected Dashboard-line. If enabled, there is even an ability to change the values of the properties.

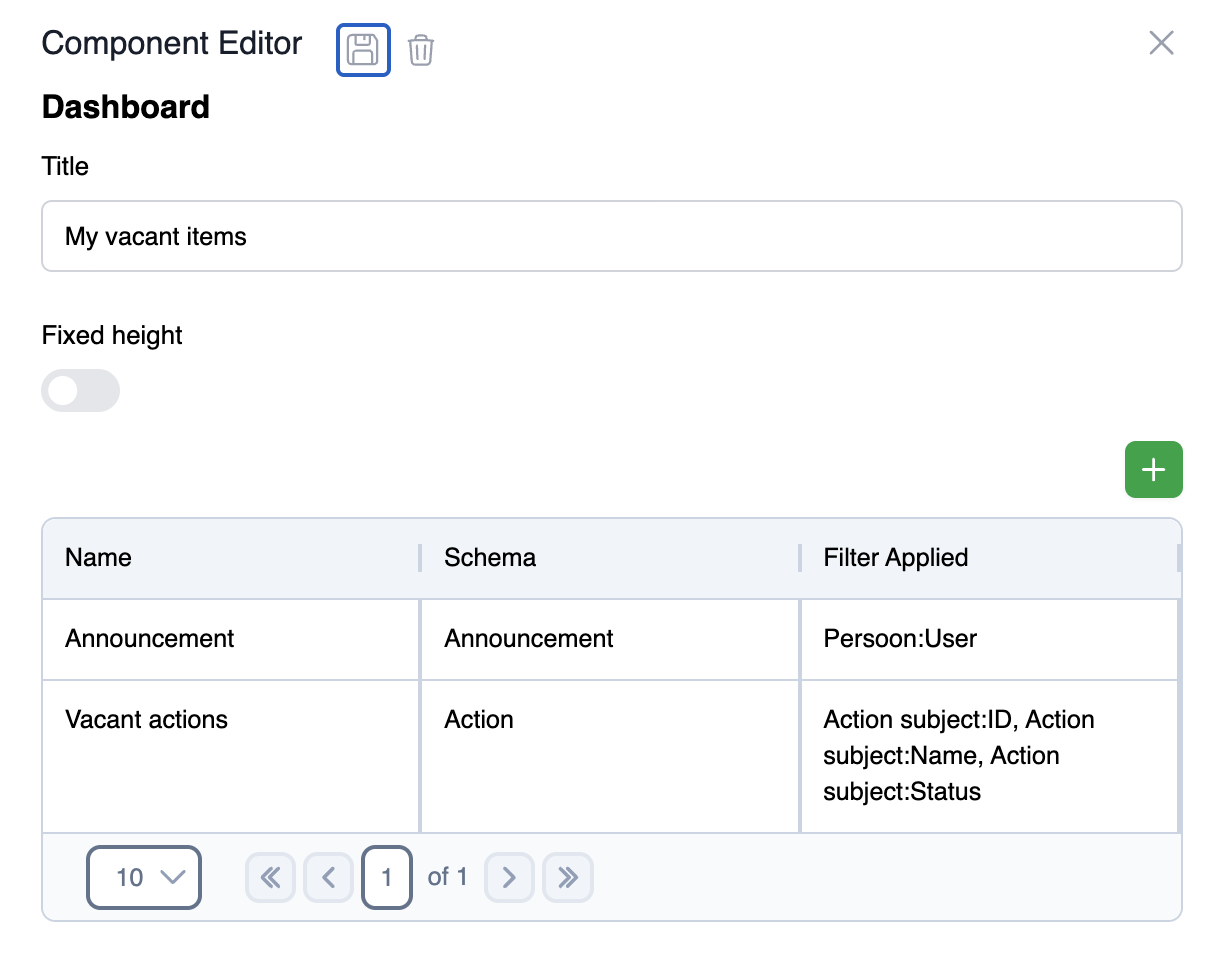
To change the information displayed in the dashboad, go to page design in the top right of the page and click on edit component. On the right, the detail page of the dashboard appears. The provides an overview of the Dashboard-lines, which schema is the rootschema and the filters that are applied on this schema. To add a new Dashboard-line, click on the green plus button.
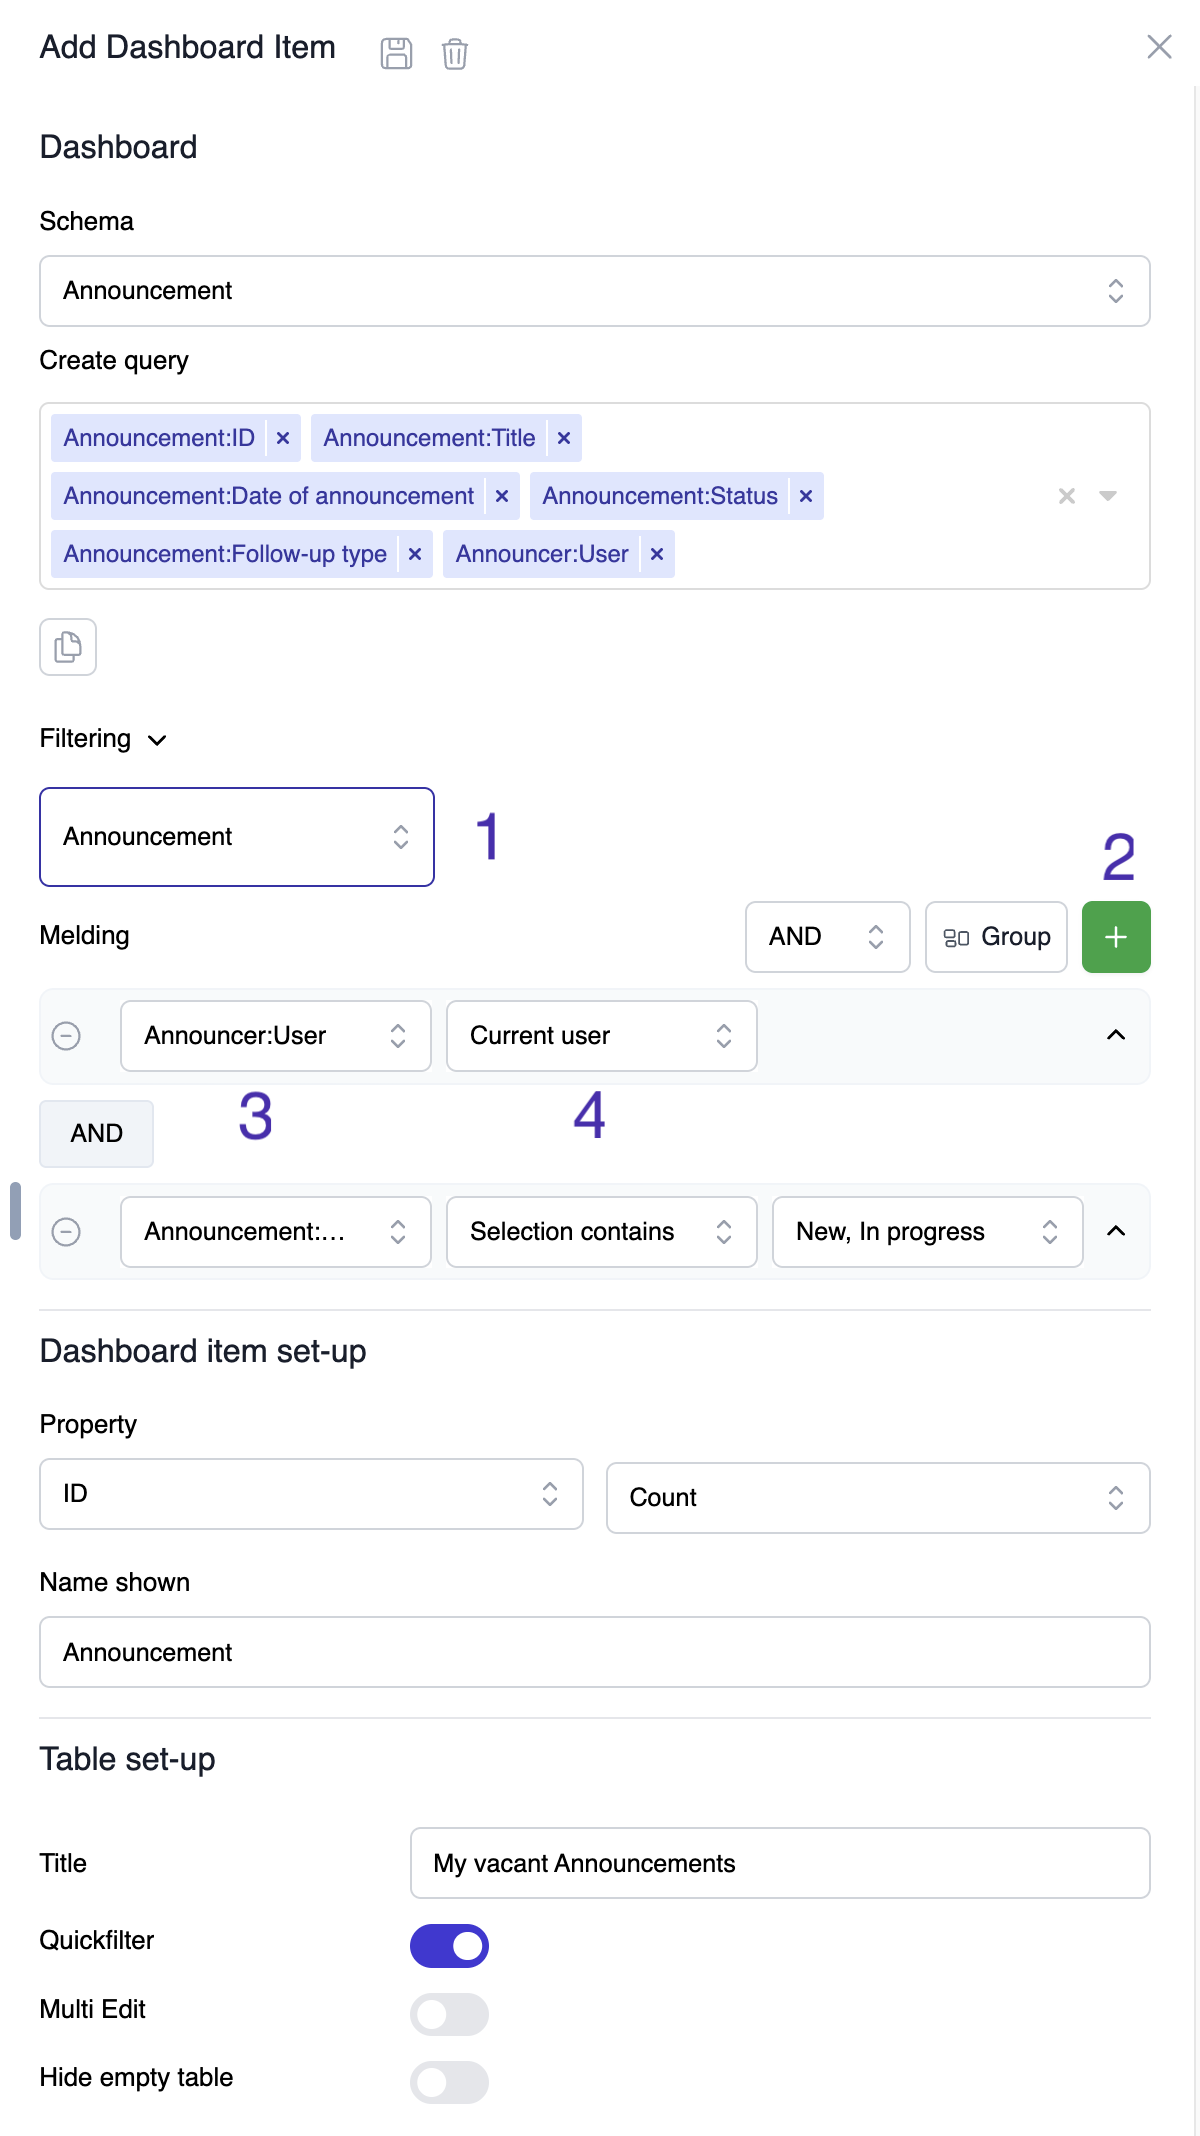
The root-schema of the Dashboard-line can be selected in the schema dropdown. Once this is done, you can query the data to show in the popup-table. Use filtering to ensure only the required data is queried.
At the Dashboard item set-up, you can determine which number is shown in the Dashboard-line. Select the property of the class you want to display a metric of. There are 3 options that can be selected in the section on the right side below property:
- Average - Shows the average of the selected values
- Count - Shows the number of instances of the selected values
- Sum - Shows the sum of the selected values
In the name shown section you can insert a description for the value shown on the dashboard.
Over at Table set-up, you can set the popup-table layout. More on the available settings of the table can be found here.